
Interictal:
Ictal:
MRI
PET
Ictal SPECT
PREVIOUS MEG (8 months previously)
Since the previous MEG had been unrevealing, a repeat MEG was ordered. During this second MEG, obtained with reduced anti-epileptic medications, the patient had both interictal abnormalities as well as seizures. In Figure 1, sharp waves are localized to the right parietal operculum. Figure 2 shows single equivalent current dipole localization of right frontal polyspikes which - on EEG - had shown minimal manifestations.
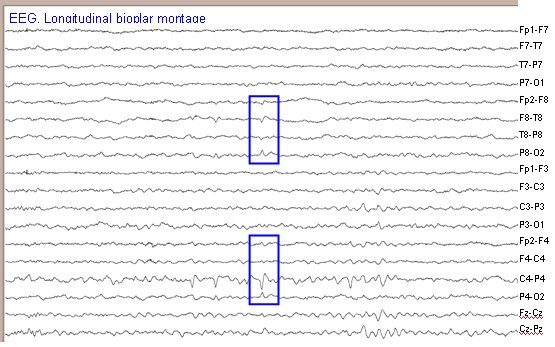
Figure 1A. The EEG recorded simultaneously with the MEG is displayed in the conventional bipolar longitudinal montage (aka “double banana”). The first four channels are left temporal, next four are right temporal, channels 9-12 are left parasagittal, 13-16 are right parasagittal, and 17-18 are midline. An example of the sharp waves seen in EEG and MEG, and analyzed in 1C, is outlined in blue.
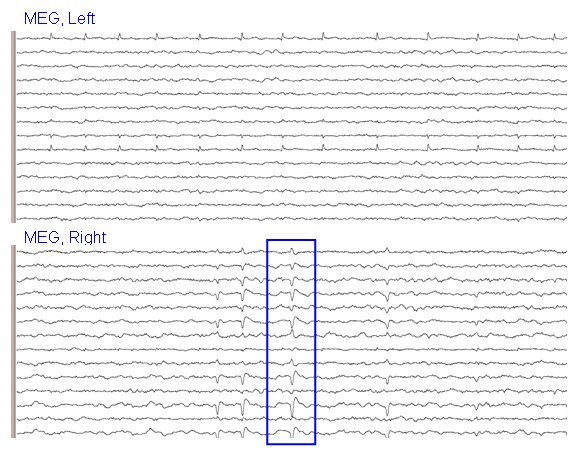
Figure 1B. Same time period as the EEG sample in 1A. Only 28 out of the 306 MEG sensor channels are shown . The blue outline, which covers the same epoch as on the EEG, shows the epoch employed for dipole fitting.
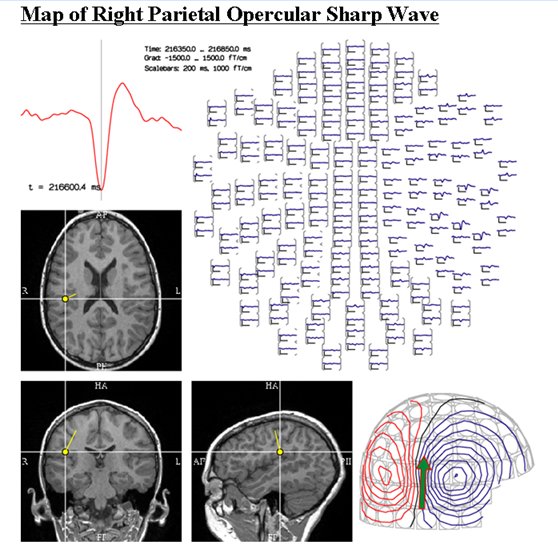
Figure 1C. Results of the dipole fitting procedure. The waveform of the highest channel is shown in detail in red in the top left, and all of the gradiometer channels, arranged topographically, are shown in the top right. The bottom right displays the magnetic field picked up by the sensors at the time point indicated by the grey cursor on the waveform; note the classical dipolar field distribution. At the bottom left, the results of a single equivalent current dipole fitting are coregistered to the patient’s MRI.
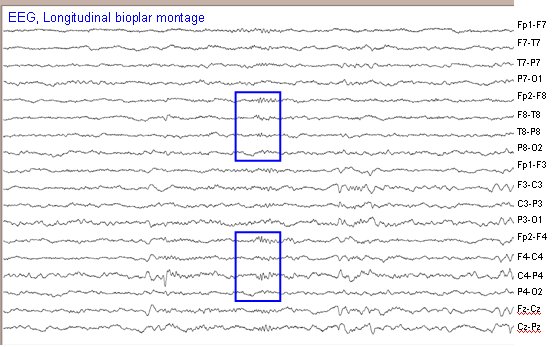
Figure 2A. In figure 2, the same procedure outlined in Figure 1 is followed, but this time to evaluate a more subtle poyspike discharge.
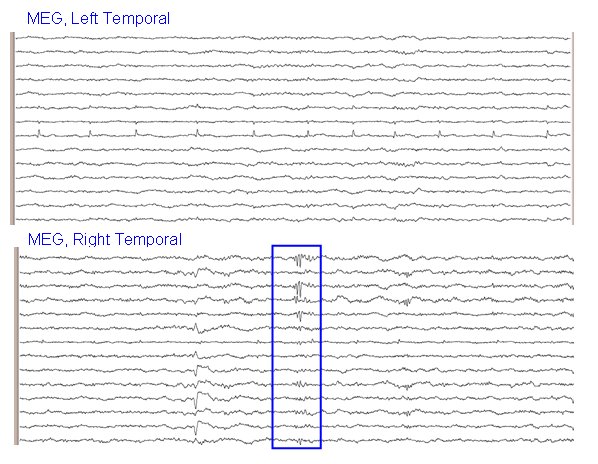
Figure 2B. MEG activity associated with the polyspikes on EEG. Same time period as in Figure 2A.
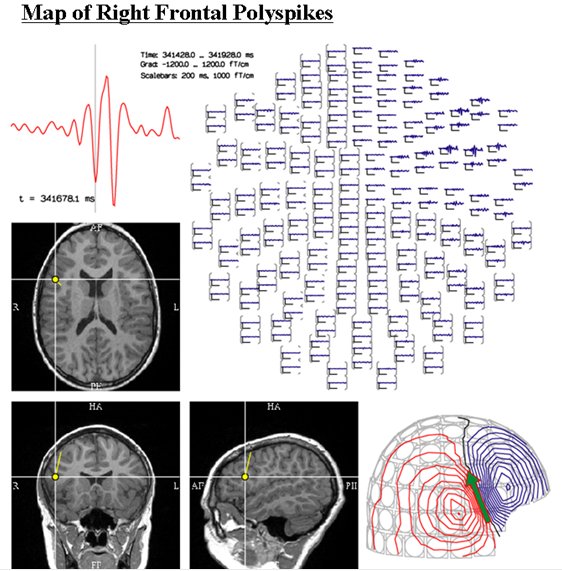
Figure 2C. The results of evaluation of the polyspike activity show a source in the right frontal lobe.
In contrast to the previous MEG, there were frequent interictal epileptiform discharges noted in the MEG channels, as shown in Figure 3, some of which had EEG correlates. Two clusters of dipoles were noted: right parietal operculum (posterior to central sulcus) and in the right inferior/middle frontal gyrus.
Seizure activity was dissected using sequential dipole analysis. In Figure 4, the selected portions at the onset of the seizure are indicated, and the localization at each point is noted.
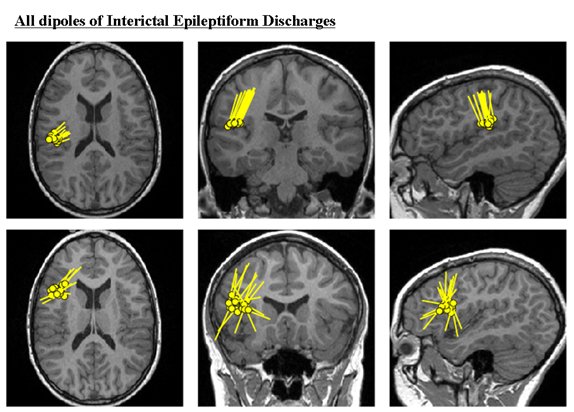
Figure 3. In figure 3, all of the interictal discharges selected for localization are shown as dipole locations. The circles represent the origin of the activity, and the tails show the orientation. The location of at least 5, and preferably 10-20 discharges, should be calculated in order to have sufficient confidence in the results of SECD analysis.
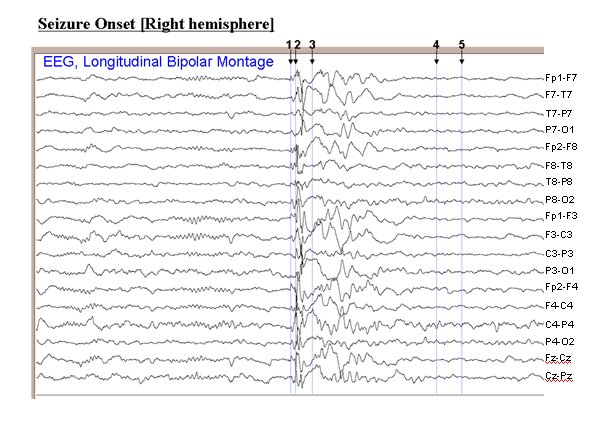
Figure 4A. The patient also had a seizure lasting 55 seconds during the MEG-EEG recording. Several time segments at the onset of the seizure were selected for analysis.
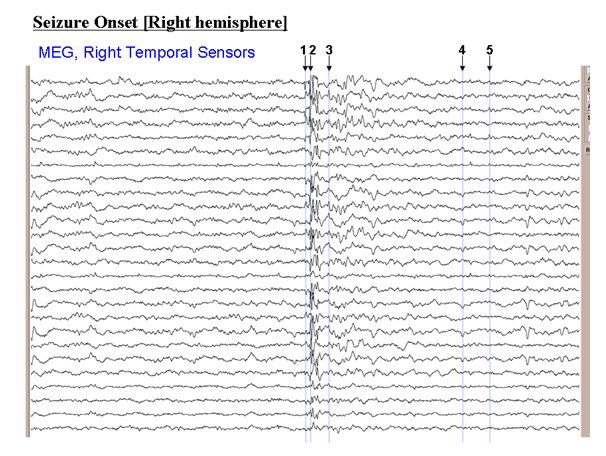
Figure 4B. The time segments shown on the MEG channels correspond to the selections on the EEG in 4A.
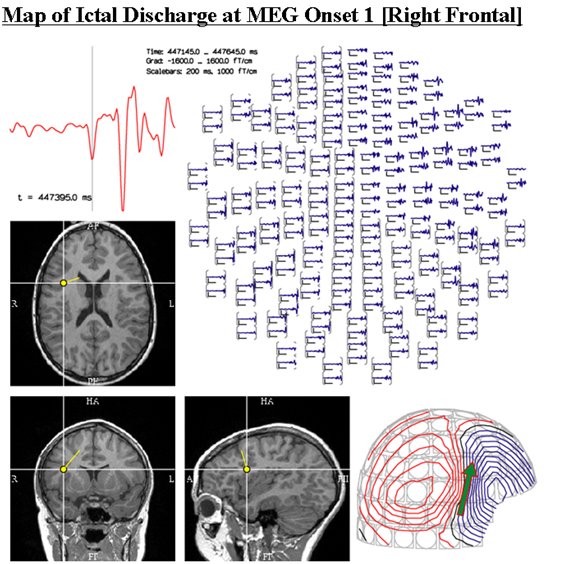
Figure 4C. Dipole localization, as described for Figure 1C, was carried out on the first time point highlighted on the waveforms shown in 4A and 4B.
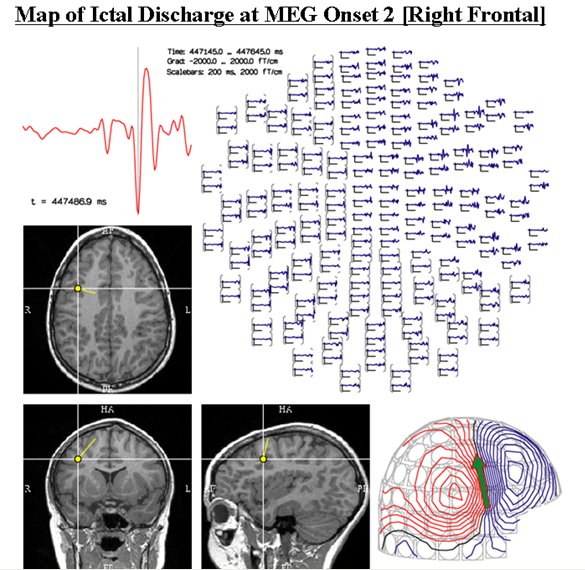
Figure 4D. Dipole localization of the second time point in the seizure onset.
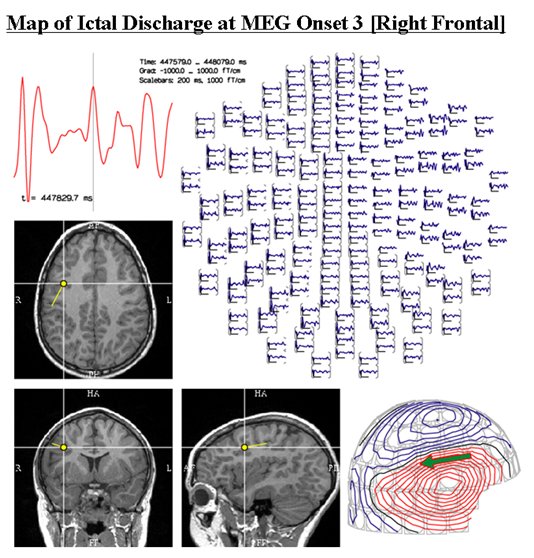
Figure 4E. Dipole localization of the third time point.
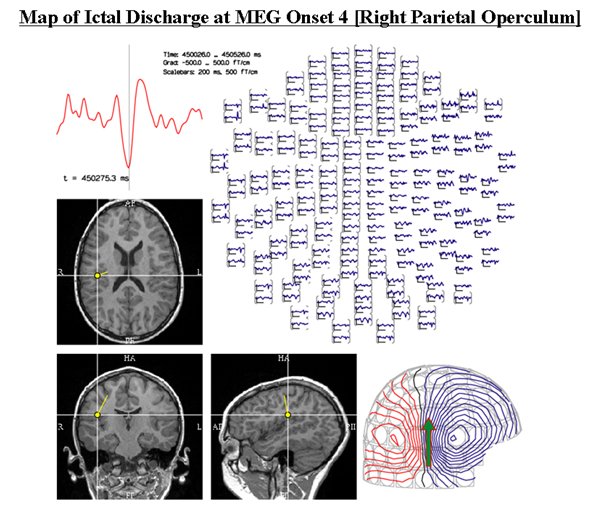
Figure 4F. Dipole localization of the fourth time point.
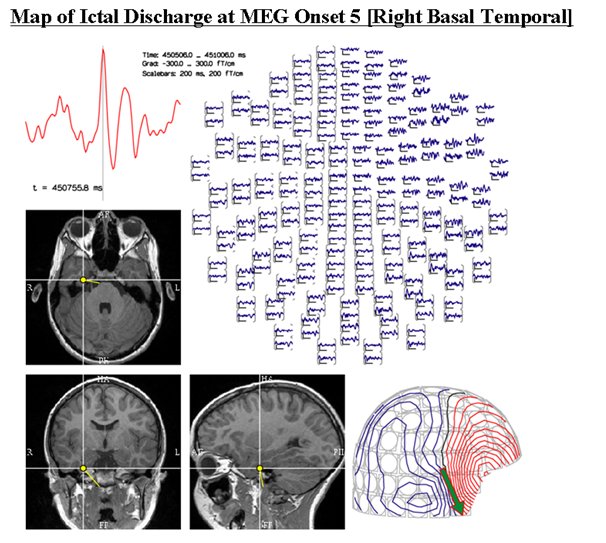
Figure 4G. Dipole localization of the fifth time point.
The patient had one typical automotor seizure with prominent oral and gestural automatisms. The ictal EEG consisted of generalized polyspikes followed by repetitive sharp waves in the right temporal and parietal region. Analysis of the ictal MEG showed activity in the right frontal followed by the right parietal operculum, with propagation to the right basal temporal region.