
The first spike (#1) shown in this case analysis is an example of the inter-ictal discharges seen clearly on EEG, but apparently midline.
Figure 1A Spike #1 on EEG. The EEG recorded simultaneously with the MEG is displayed in the conventional bipolar longitudinal montage (aka “double banana”). The first four channels are left temporal, next four are right temporal, channels 9-12 are left parasagittal, 13-16 are right parasagittal, and 17-18 are midline (Fz-Cz and Cz-Pz). Note that the spike outlined in blue can be seen clearly only at electrode Cz, and cannot be lateralized.

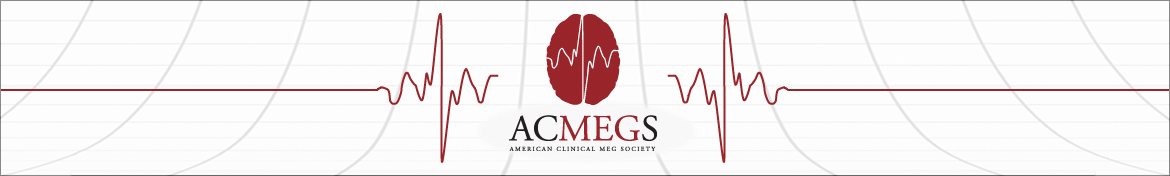
Figure 1B Spike #1 on EEG. Same time segment as shown in Figure 1B, but the EEG montage is a transverse bipolar. The spike outlined in blue, the same one as in Figure 1A, again shows a phase reversal exactly in the midline on this transverse run.
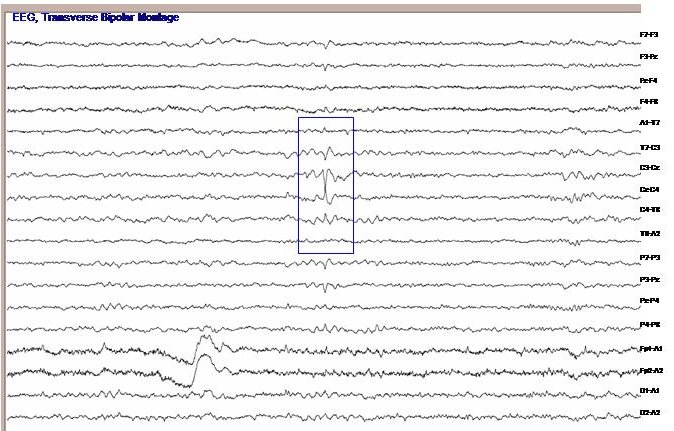
Figure 1C Spike #1 on MEG. On the simultaneously recorded MEG, the discharges appeared larger in the left sensors. Without co-localizing to the patient’s head, however, this could be a function of head position. The MEG machine monitors and corrects for patient head position ten times per second.
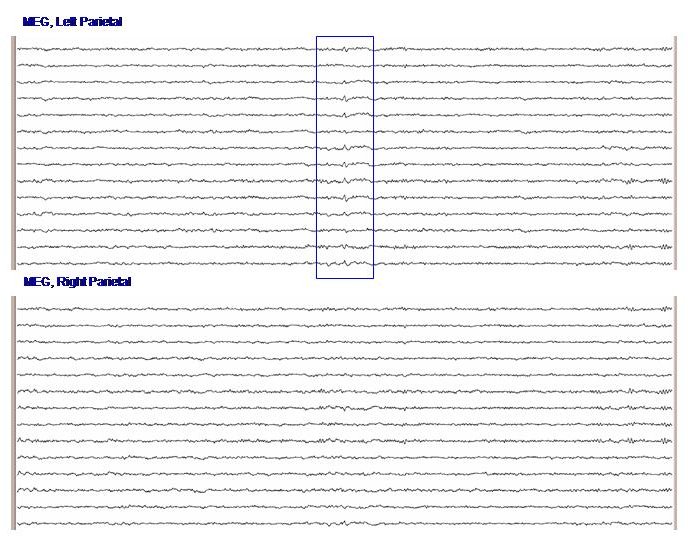
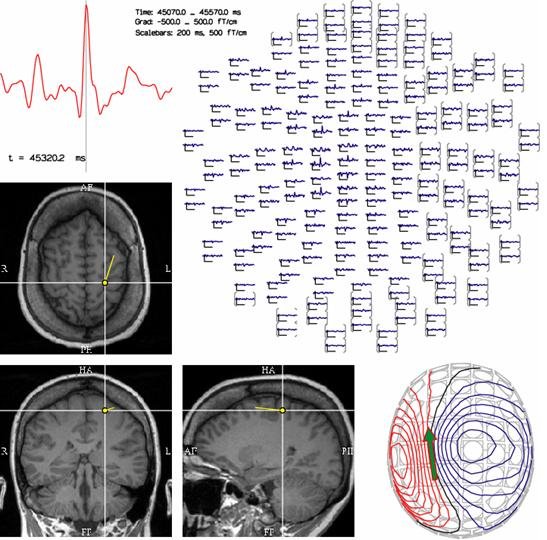
Figure 1D Spike #1 Source Localization. Single equivalent current dipole analysis demonstrates that the interictal discharge is arising from the left mesial frontal region. The waveform of the highest channel is shown in detail in red in the top left, and all of the gradiometer channels, arranged topographically, are shown in the top right. The bottom right displays the magnetic field picked up by the sensors at the time point indicated by the grey cursor on the waveform; note the classical dipolar field distribution. At the bottom left, the results of a single equivalent current dipole fitting are coregistered to the patient’s MRI.
The second exemplar spike (#2) appears higher on the left in the scalp EEG, but EEG localization is difficult, as displayed in Figure 2A.
Figure 2A Spike #2 on EEG. An interictal discharge that is complicated with polyspike components. Same montage as in Figure 1A.
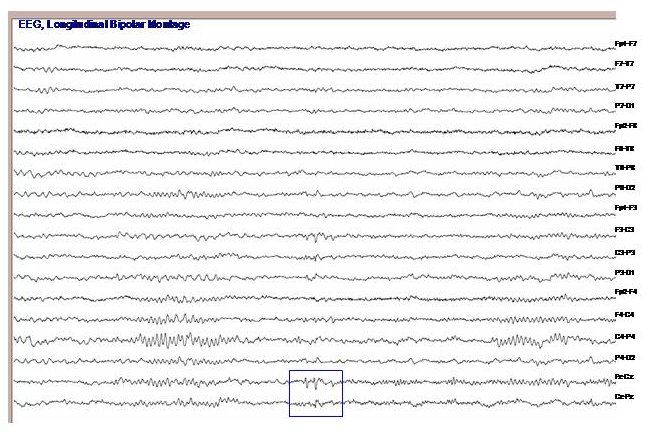
Figure 2B Spike #2 on MEG. Waveforms capturing the second spike, from the same MEG sensors as shown in Figure 1C, are displayed.
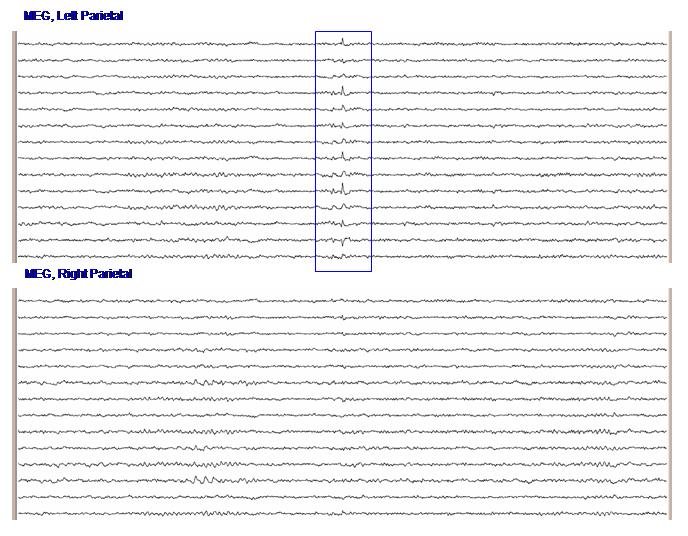
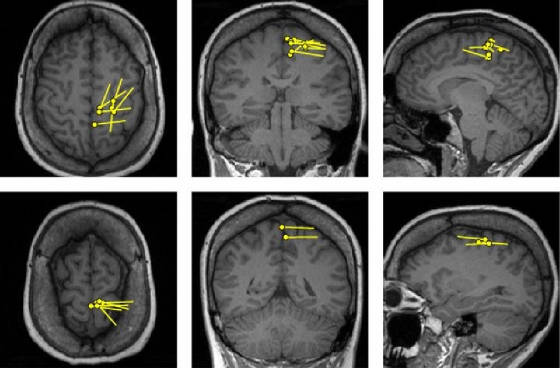
Figure 2C Spike #2 Source Localization. SECD analysis of this discharge locates it to a similar, but somewhat more lateral position in the frontal lobe than spike #1.
Another type of discharge seen during this one-hour MEG-EEG recording is blunted and very poorly localizing on EEG. In order to confidently localize this patient’s irritative zone, several examples of each form of interictal discharge were subjected to SECD analysis on MEG.
Figure 3A Spike #3 on EEG. There were a variety of interictal discharges in this patient. On EEG, all appeared to arise from the midline, but some were much less prominent than others. This last example is particularly difficult to localize from EEG
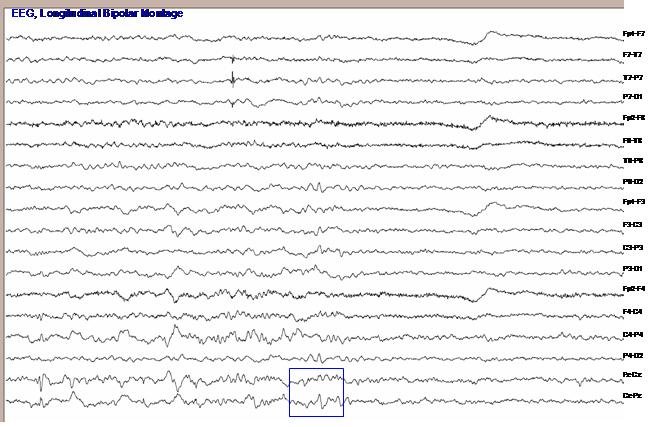
Figure 3B Spike #3 on MEG. The discharges again appeared maximal in the parietal sensors of the MEG recording array.
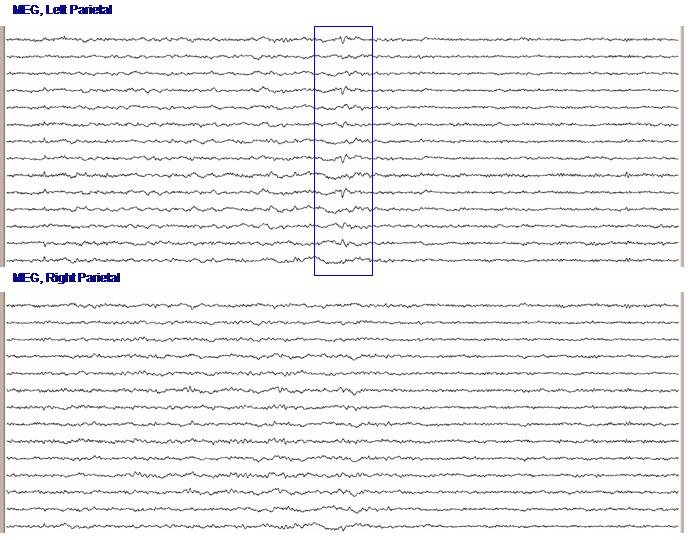
Figure 3C Spike #3 Source Localization. Despite the very different and poorly localized appearance on EEG, the MEG SECD analysis also places this source in the mesial frontal lobe.
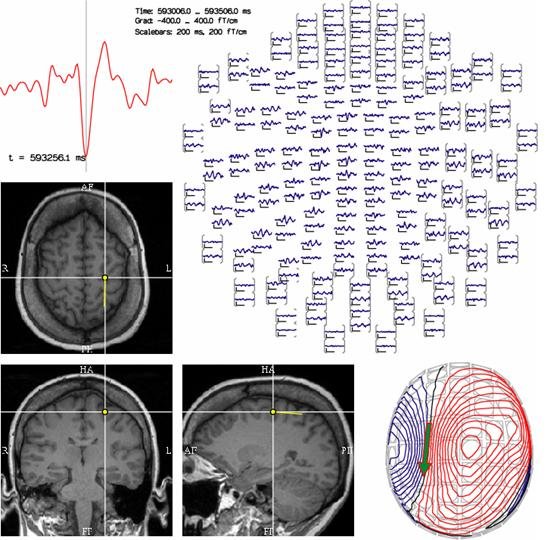
Figure 4 All Spikes. The locations determined by SECD analysis of all of the interictal discharges chosen for the report reside in a restricted area of the left frontal lobe.
With the hemisphere and lobe firmly established by MEG, this patient was deemed a surgical candidate. Because of the proximity of the putative epileptogenic zone to eloquent cortical areas, the patient underwent an evaluation with intracranial electrodes. The placement of the SEEG electrodes, shown in Figure 5 was determined from the MEG, along with the results of other tests.
Figure 5 Invasive Evaluation. This three dimensional, post-implant view has been rotated to convey an almost perpendicular sagittal view. It shows the locations of the 11 SEEG electrodes; their contacts are displayed as green circles and the scalp anchoring point is shown in red. The dipoles, illustrated in Figure 4, are displayed here in pale blue in relation to the SEEG electrodes.
